Main Article Content
Aug 31, 2007
Abstract
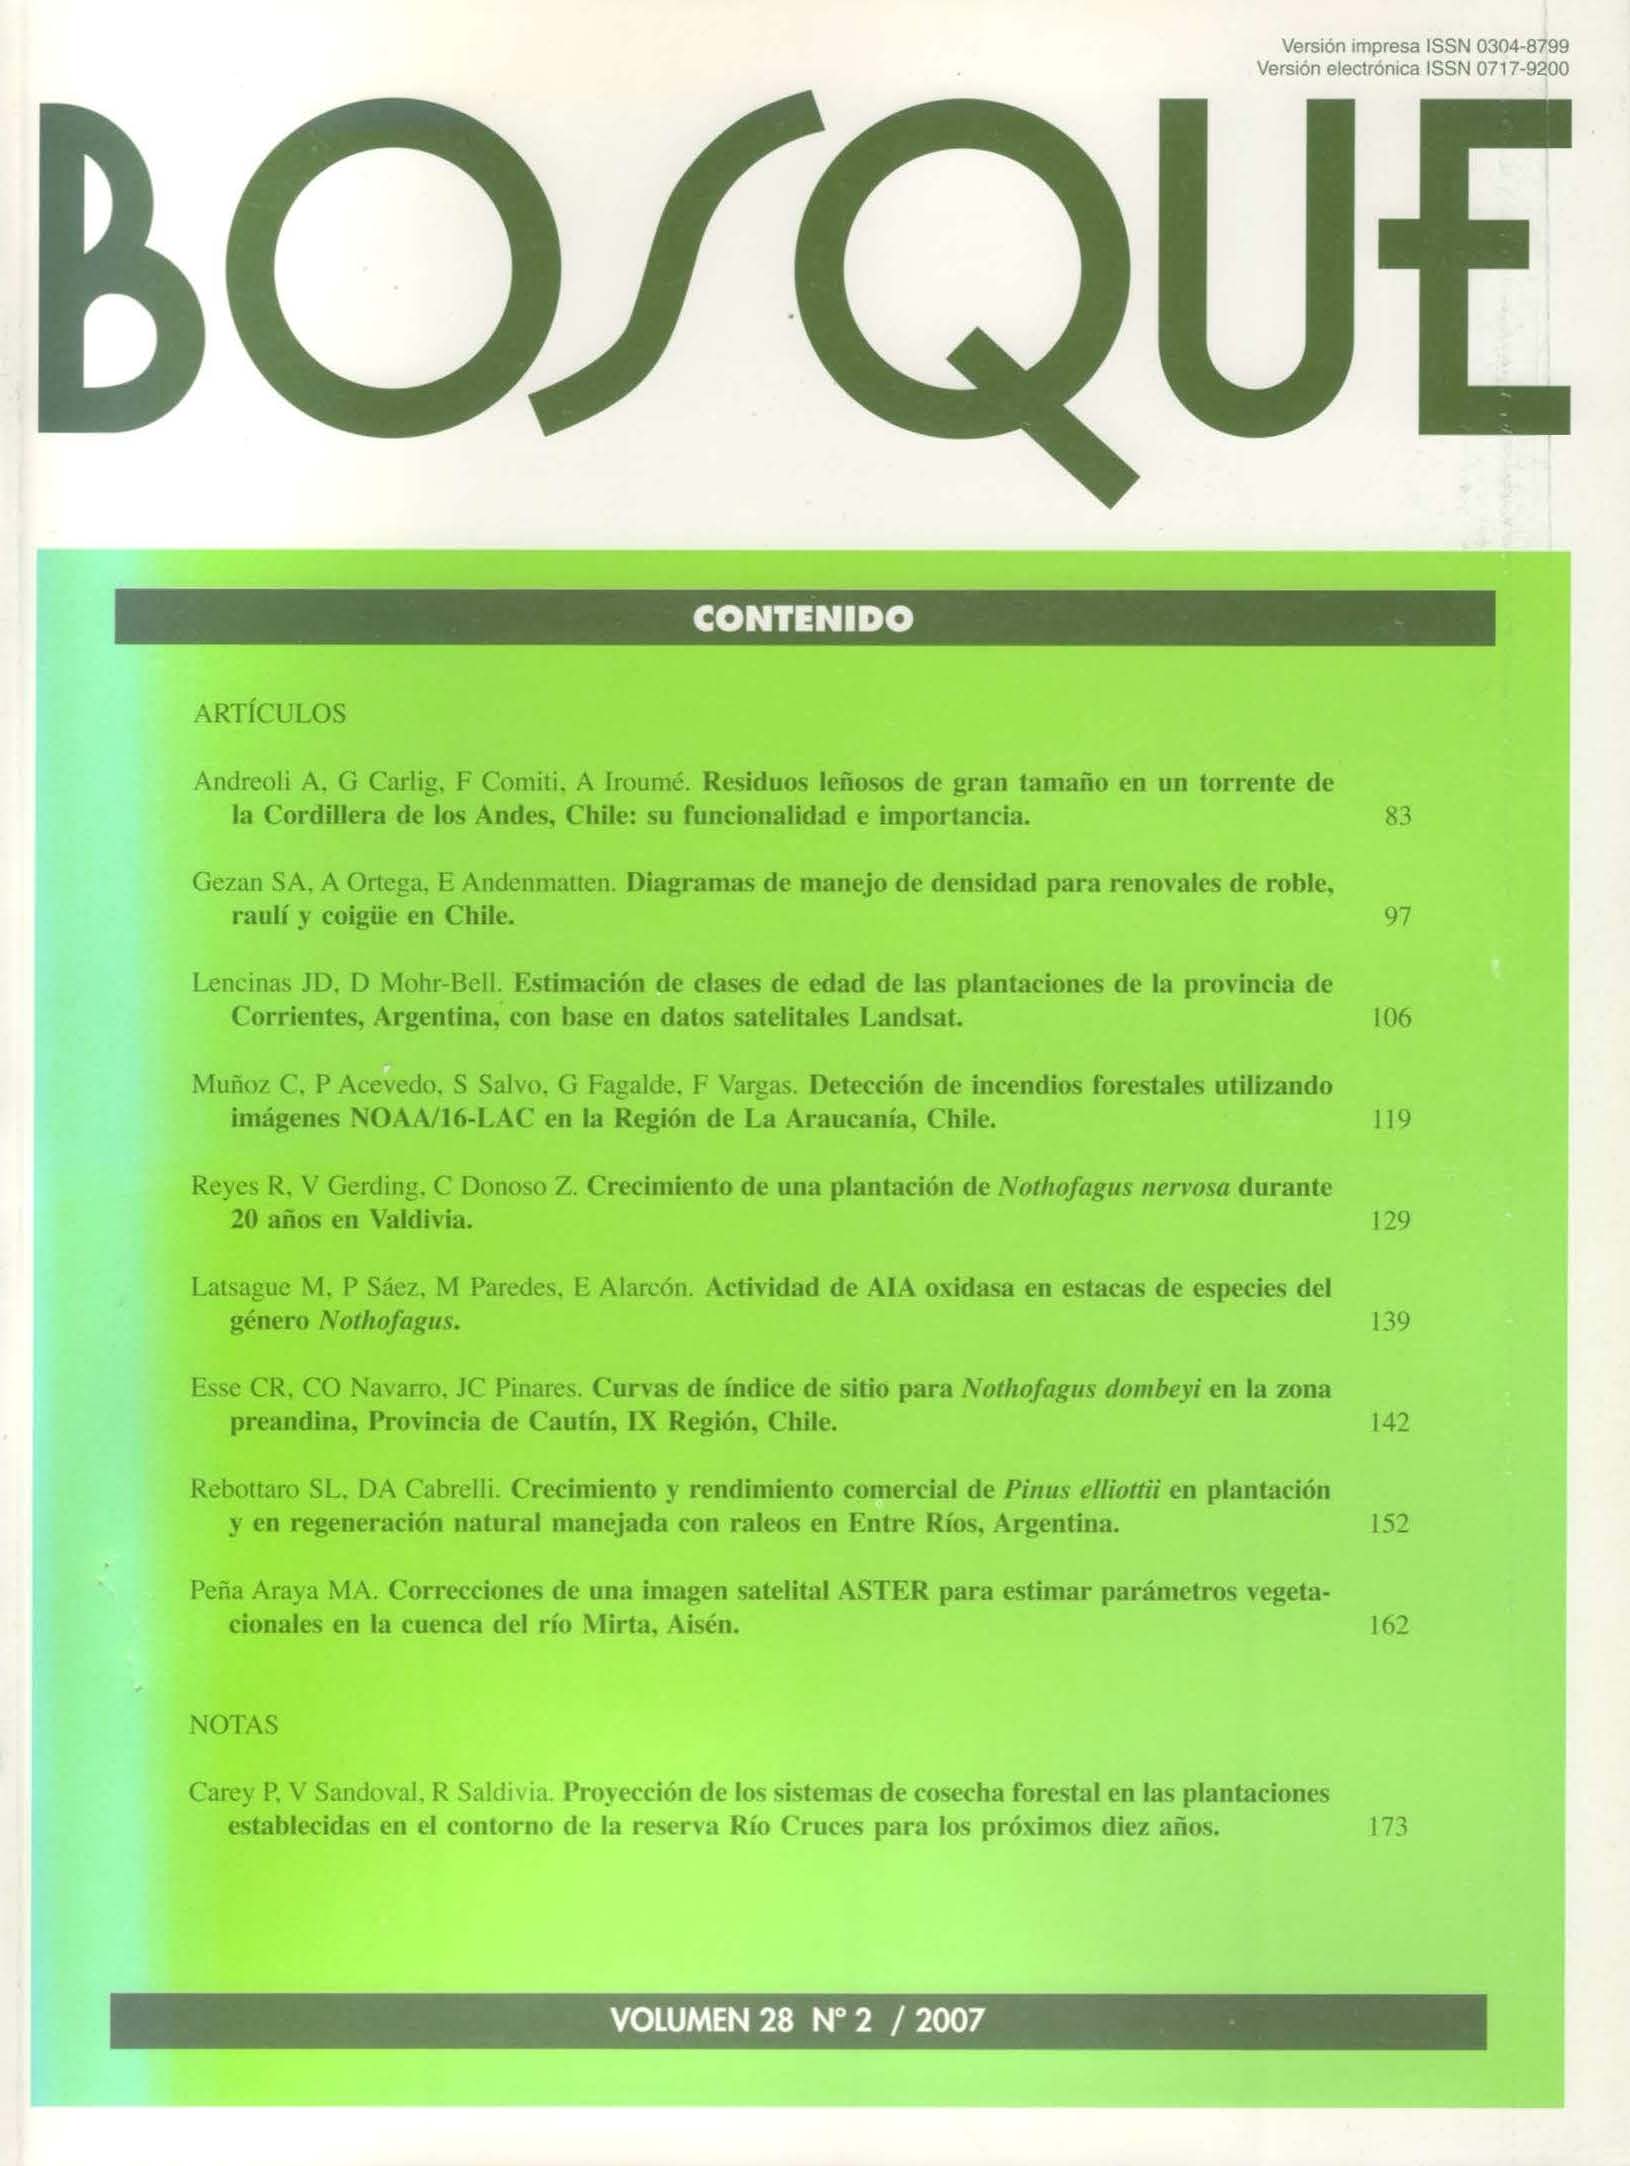
A total of 214 permanent and temporary plots from roble (Nothofagus obliqua), raulí (N. alpina) and coigüe (N. dombeyi) pure and mixed second growth forests located between 37°30’ and 42°00’ south latitude in Chile were used to fit an average size-density model. This model was then modified to obtain maximum density curves, and to construct stocking management charts with the aim to support planning of thinning, and to help the application of CONAF´s second growth forests management guidelines. The final size-density model considered a common slope and specific intercepts for three different compositions: raulí mixed, roble and coigüe. Comparisons of these models with others reported in the literature showed an acceptable level of similarity. Concerning load site capacity, the lowest levels were found for the composition roble, and the highest for coigüe. The following reference lines are suggested for the use of the presented stocking charts: 100% (line A or maximum density), 60% (line B or beginning of self-thinning), 30% (line C or load site capacity inferior limit), and 20% (line D or minimum density). Additionally, applications and methodology for the construction of these stocking charts are fully described together with concepts related to each of the reference lines.


